Metrics Are Not Enough: Adding Searchable History to BullMQ
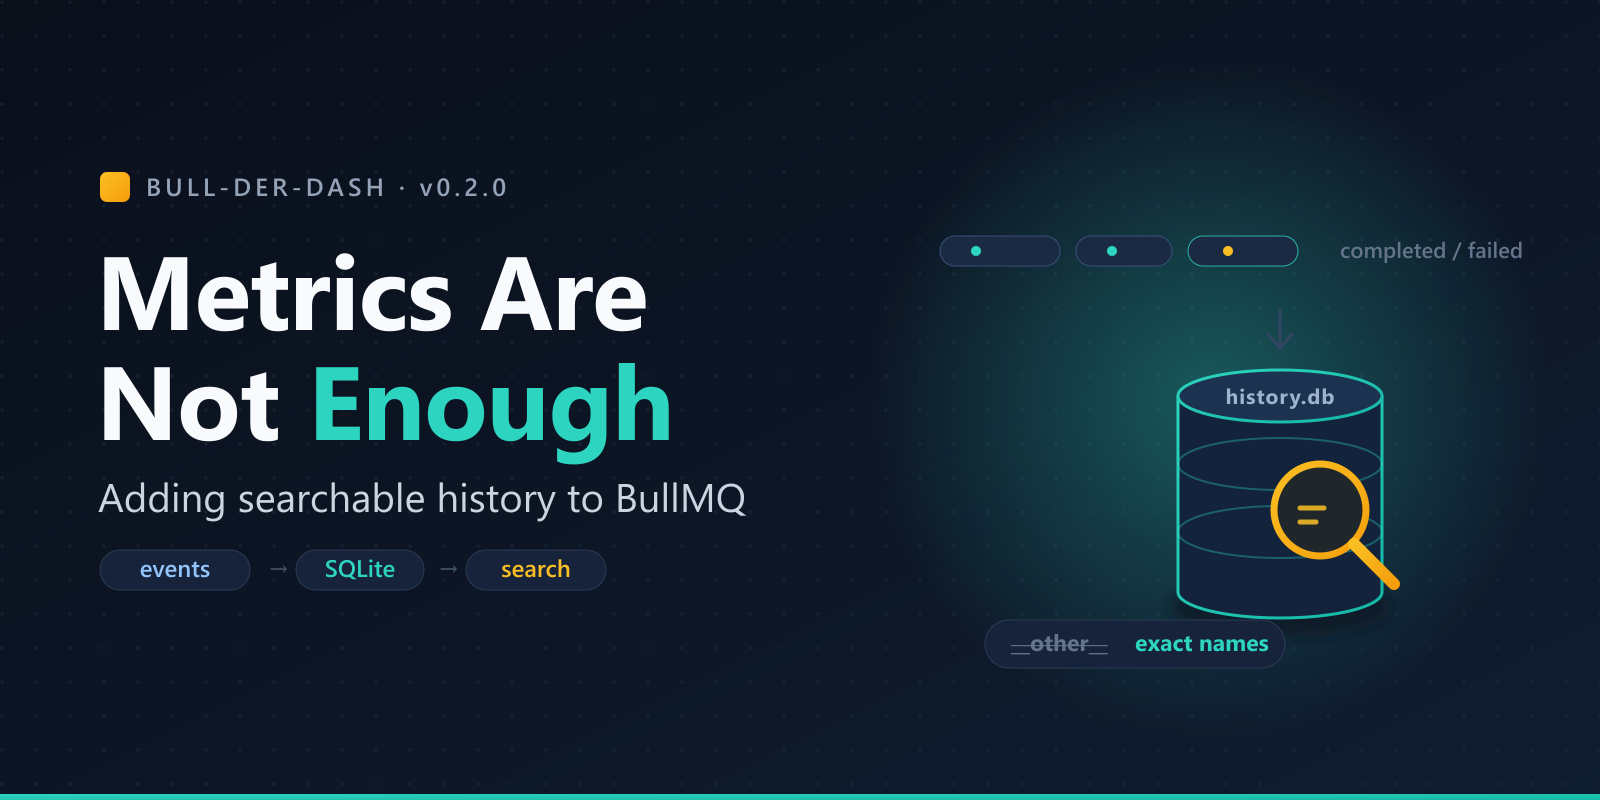
How bull-der-dash grew an embedded SQLite history store, full-text search, and exact per-job-name stats — without reintroducing the Redis-scanning problem I warned about last time.
A while back I wrote Queue Depth Is Not Enough: Adding Workload Metrics to BullMQ. The argument was simple: knowing how many jobs are waiting, active, failed, and completed tells you about backlog, but not about behavior. So I added workload metrics to bull-der-dash — completion counts, duration percentiles, and failure ratios by queue and job name — by reading BullMQ's event streams incrementally instead of scanning retained jobs.
That post ended on a principle I still believe:
The easiest metric to compute is not always the safest metric to collect.
This is the follow-up, because workload metrics turned out to not be enough either.
The Questions Prometheus Can't Answer
Aggregate metrics are wonderful. They are also, by design, lossy.
Prometheus can tell me that the send-device-action job failed 14 times in the last five minutes. It cannot tell me which 14 jobs, what they contained, or why they failed. It can show me a p99 duration climbing. It cannot hand me the single slow job so I can read its payload.
Once you are running real workloads, the questions get specific in a way that time-series data simply cannot hold:
Show me that failed job. What was in it? What was the error?
This job errored, retried, and eventually succeeded — can I still find it?
A flow kicked off a cascade of child jobs. What actually happened across the whole tree?
Which exact job names ran last night? Not the top 100 — all of them.
That last one stung the most, because it was a limitation I had shipped on purpose.
The __other__ Debt
In the first version, adding a name label to metrics was useful but dangerous. Prometheus cardinality explodes if a label carries unbounded values, so the collector caps the number of distinct job names per queue. Everything past the cap gets bucketed under a single catch-all:
bullmq_jobs_finished_total{queue, name="__other__", result}
That guardrail was correct. It was also a slow leak of truth. On a busy production queue, __other__ filled up fast, and the exact tail of job names — often the interesting part during an incident — disappeared into an aggregate I could never expand.
I did not want to remove the cardinality cap. Removing it is how you turn a monitoring tool into a Prometheus outage. I wanted a second source of truth that was allowed to be exact, because it lived somewhere that didn't punish cardinality.
That somewhere is a local database.
The Part Where I Argue With My Past Self
If you read the first post, you know the problem. I spent several paragraphs explaining why scanning retained jobs in Redis is the wrong shape for a production monitoring path:
bad model:    metric cost ~= retained jobs
better model: metric cost ~= newly finished jobs
And now here I am, adding persistent history. Record-level history. The exact thing that sounds like "scan all the jobs and keep them."
So the design question was not "should I add history?" It was:
Can I add durable, searchable, record-level history without making Redis pay for it?
The answer is yes — because the history store is not fed by scanning Redis. It is fed by the event stream the collector was already reading.
One Event Stream, Two Consumers
The workload collector already watches BullMQ's per-queue event streams and reacts to terminal (completed / failed) events. For each one, it reads only the fields it needs from the job hash:
HMGET bull:{queue}:{jobId} name processedOn finishedOn ...
In the first version, that data flowed one way: into in-memory Prometheus counters and histograms.
In v0.2.0, the same terminal event fans out to a second consumer. The collector hands a record to an embedded SQLite store:
type JobStore interface {
    Enqueue(store.Record)
}
The Redis cost does not change. It is still proportional to newly finished jobs, not to retained history. Redis never gets scanned for history, and /metrics never touches the database. The history lives on local disk, and querying it is somebody else's budget — the database's, not the queue's.
Same stream. Two sinks. One cheap, aggregate, and in-memory; one durable, exact, and on disk.
Writing History Without Blocking Anything
Enqueue is deliberately non-blocking. The collector loop must never stall waiting on a disk write, so writes go through a buffered channel drained by a background writer that batches them into SQLite transactions:
STORE_WRITE_BUFFER = 4096   # in-memory channel depth
STORE_BATCH_SIZE   = 256    # max records per write transaction
STORE_FLUSH_MILLIS = 500    # max time a partial batch waits
If the buffer ever fills — a write burst outrunning the disk — records are dropped and counted, never queued into backpressure that could reach the collector. A monitoring tool is allowed to lose a little telemetry under extreme load. It is not allowed to become the bottleneck. That was the whole thesis last time, and it still holds.
In production this costs almost nothing. The store flushes batches in well under 25ms, and the whole process sits around 8 MiB RSS — the same low-footprint Go story from the first post, now with a database attached.
What Actually Gets Stored (and What Doesn't)
The store only persists terminal events: completed and failed. Transient states — active, waiting, delayed — are never written. That keeps the live queue completely out of the history write path, and it means the store is a settled, append-mostly record of work that finished.
There's a subtlety that aggregate metrics can't express but a record store can. BullMQ emits a failed event only once a job has exhausted its retries. A job that threw on attempt one but succeeded on attempt two is, correctly, Completed — yet it still carried an error and burned an extra attempt. The store keeps both the final state and the last error and true attempt count, so you can ask a question Prometheus can't:
GET /v1/search?errored=true
errored=truemeans "last error present or more than one attempt" — the retried, troubled, eventually-fine jobs that a pure success/failure count renders invisible.
Flows Get a Trace and a Depth — For Free
BullMQ's FlowProducer builds parent/child job trees. When a terminal event belongs to a flow, the collector resolves two things by walking the job's native parent chain in Redis:
a trace id — the id of the flow root
a depth — how far down the tree this job sits
No payload convention is required. There's an optional STORE_TRACE_KEYS override if you already stamp a correlation id into job data, but by default the lineage comes straight from BullMQ's own flow links. The walk is bounded (a cycle or a pathologically deep flow can never stall the loop) and memoized, so flow-heavy workloads don't re-pay the cost:
trace  = flow-root job id
depth  = parent-chain distance from the root
The result: in the console, legitimate trace ids with real reported depth line up exactly with flow jobs, and you can pull an entire cascade back out of history by its trace.
The Console
All of this surfaces in a new full-text search console at /console, available whenever the store is enabled. It is backed by a small JSON API that is safe to call directly:
GET /v1/search?q=&name=&state=&trace_id=&errored=&since_ms=&limit=
GET /v1/jobs/{id}
GET /v1/stats/job-names?queue=&state=&since_ms=&limit=
state only matches the settled states the store actually records (Completed / Failed), and since_ms is a standalone "finished within" window. Reads are concurrency-limited (STORE_READ_CONCURRENCY, default 16) and shed load with a 503 rather than letting search traffic swamp the writer — the same "protect the hot path" instinct, applied to the read side.
Paying Off the __other__ Debt
That /v1/stats/job-names endpoint is the exact fix for the cardinality compromise. It reads the raw, uncapped job name recorded for every job, grouped and counted in SQL:
[
  { "name": "send-device-action", "queue": "actions", "state": "Completed", "count": 4127 },
  { "name": "reconcile-room",      "queue": "sync",    "state": "Completed", "count":  318 },
  ...
]
No cap. No __other__. Ever. The Prometheus metric keeps its cap because cardinality safety is non-negotiable on the time-series path — but the dashboard's "Top job names" table now reads from history instead, so it reports the real distribution. In Grafana that's a single Infinity datasource panel pointed at the endpoint, scoped to the dashboard's time range.
Two sources of truth, each honest about what it's for: Prometheus for cheap aggregate trends, SQLite for exact record-level answers.
Keeping It Bounded
A database that only grows is a future outage. History is swept on a tiered TTL so it reaches a steady state instead of filling the disk:
STORE_COMPLETED_TTL_HOURS = 24    # completed history kept 1 day
STORE_FAILED_TTL_HOURS    = 336   # failed history kept 14 days
STORE_SWEEP_SECONDS       = 300   # sweep runs every 5 minutes
STORE_MAX_ROWS            = 0     # optional hard row cap, newest kept
Failures live far longer than successes, because a two-week-old failure is still worth reading and a two-week-old success almost never is. There's an optional absolute row cap for environments where you'd rather bound by size than by time. A sweep counter (bullderdash_store_sweep_deleted_total) makes it observable that retention is actually doing its job.
The Architecture Rule, Refined Once More
Last time I drew a line between stateless HTTP serving and ephemeral state for telemetry collection. v0.2.0 moves that line again, carefully:
The request path stays cheap. The dashboard, job inspection, health checks, and
/metricsnever touch the history database.The collector stays incremental. Redis cost tracks newly finished jobs, not retained ones.
The new thing — durable, bounded, local history — is written asynchronously, off the hot path, and is allowed to drop under pressure.
Because SQLite is a single-writer database, the deployment runs a single instance with the volume mounted ReadWriteOnce and a Recreate rollout strategy, so the disk detaches cleanly on every upgrade. The same single-replica honesty from the first post: no leader election, no distributed coordination, because the simplest correct design is one writer. Running multiple replicas would mean double-reading events and double-counting — still a good future problem, still not one I needed to solve on day one.
Store Metrics, Because Of Course
The store exports its own Prometheus metrics, so the thing watching your queues is itself watchable:
bullderdash_store_writes_total
bullderdash_store_writes_dropped_total
bullderdash_store_write_errors_total
bullderdash_store_write_batch_duration_seconds
bullderdash_store_query_duration_seconds{operation}
bullderdash_store_sweep_deleted_total
If writes start dropping, you see it. If sweeps stop deleting, you see it. If query latency climbs, you see it. The monitoring tool does not get a pass on being monitored.
Rolling It Out
Like last time, the rollout was intentionally boring. Everything is behind a flag:
STORE_ENABLED=true
Same binary, store disabled by default, enabled per environment through the Helm chart alongside a persistent volume. The sequence was the familiar one: enable in a local simulator, confirm writes and sweeps, deploy to demo, build the Grafana panels, promote to production. Incremental, visible, easy to back out.
What I Can See Now
Before, I could see how my queues behaved. Now I can also:
search completed and failed history by text, name, state, or time window
pull a specific job's full payload and error back out of history
find retried-but-eventually-fine jobs that aggregate counts hide
reconstruct an entire flow by its trace id, with real depth
read the exact distribution of job names, with no
__other__bucketwatch the history store's own write, drop, and sweep health
Queue depth told me about backlog. Workload metrics told me about behavior. History tells me about specifics — the one job, the one flow, the one failure I actually need to look at.
Project Links
If you run BullMQ and want lightweight visibility — queue depth, job inspection, Prometheus workload metrics, and now durable, searchable history — I'd love issues and feedback.
Closing Thought
The lesson from the first post was that the easiest metric to compute is not always the safest one to collect. The lesson from this one is its mirror image:
The data you most want to keep is exactly the data most likely to hurt you if you keep it carelessly.
Durable history sounds like the thing I warned against. It only became safe once I refused to pay for it in the one place that mattered — the live queue. Persist the events you already read, write them off the hot path, bound their lifetime, and let them drop before they ever push back.
Observability should make production clearer. It still should not make Redis sad.


